
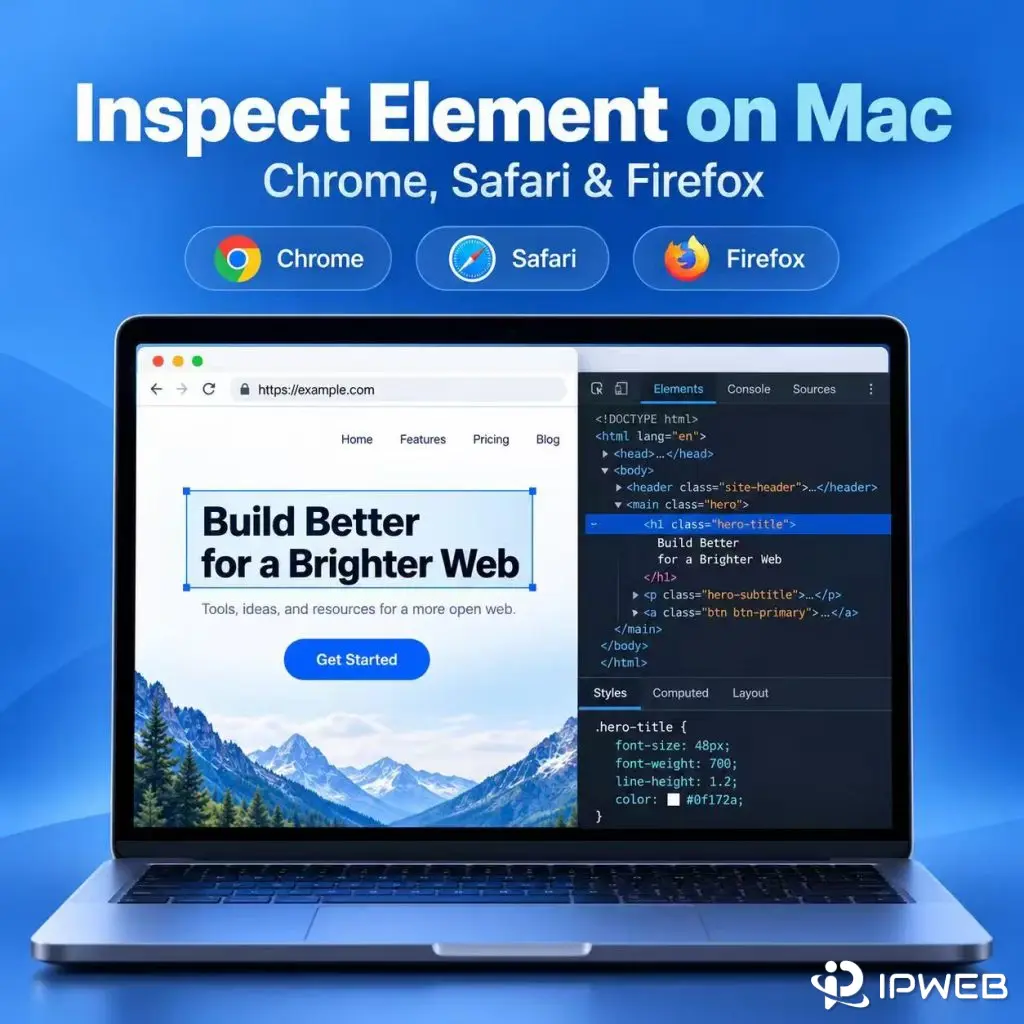
On a Mac, you can inspect a webpage in Chrome, Safari, or Firefox from the context menu or with a keyboard shortcut. Opening DevTools is only the first step: the Elements and Network panels can also show whether a visible field is already in the page HTML, added after JavaScript runs, or returned by a separate request.
Use the browser and page state that match the task you are checking. A product price, search result, listing, or other public field can appear differently before and after filters, pagination, or client-side rendering.
To Inspect Element on a Mac, Control-click a page element and choose Inspect or Inspect Element. In Chrome, Command + Option + C opens the Elements panel in inspect mode, while Command + Option + I opens DevTools. In Safari, first enable Safari > Settings > Advanced > Show features for web developers, then Control-click an element and choose Inspect Element or press Option + Command + I. Firefox also supports Control-click > Inspect and Command + Option + I for its developer toolbox.
- Chrome, Safari, and Firefox all let you inspect page structure on macOS.
- Use the Elements panel to examine DOM structure, text, attributes, and selectors.
- Use the Network panel when visible data is missing from the initial HTML or appears after interaction.
- Inspecting one page helps diagnose where data comes from; it does not replace a crawler, scraper, or browser automation workflow.
- Developer tools do not grant permission to access private, restricted, or otherwise unauthorized data.
Inspect Element in Chrome on Mac
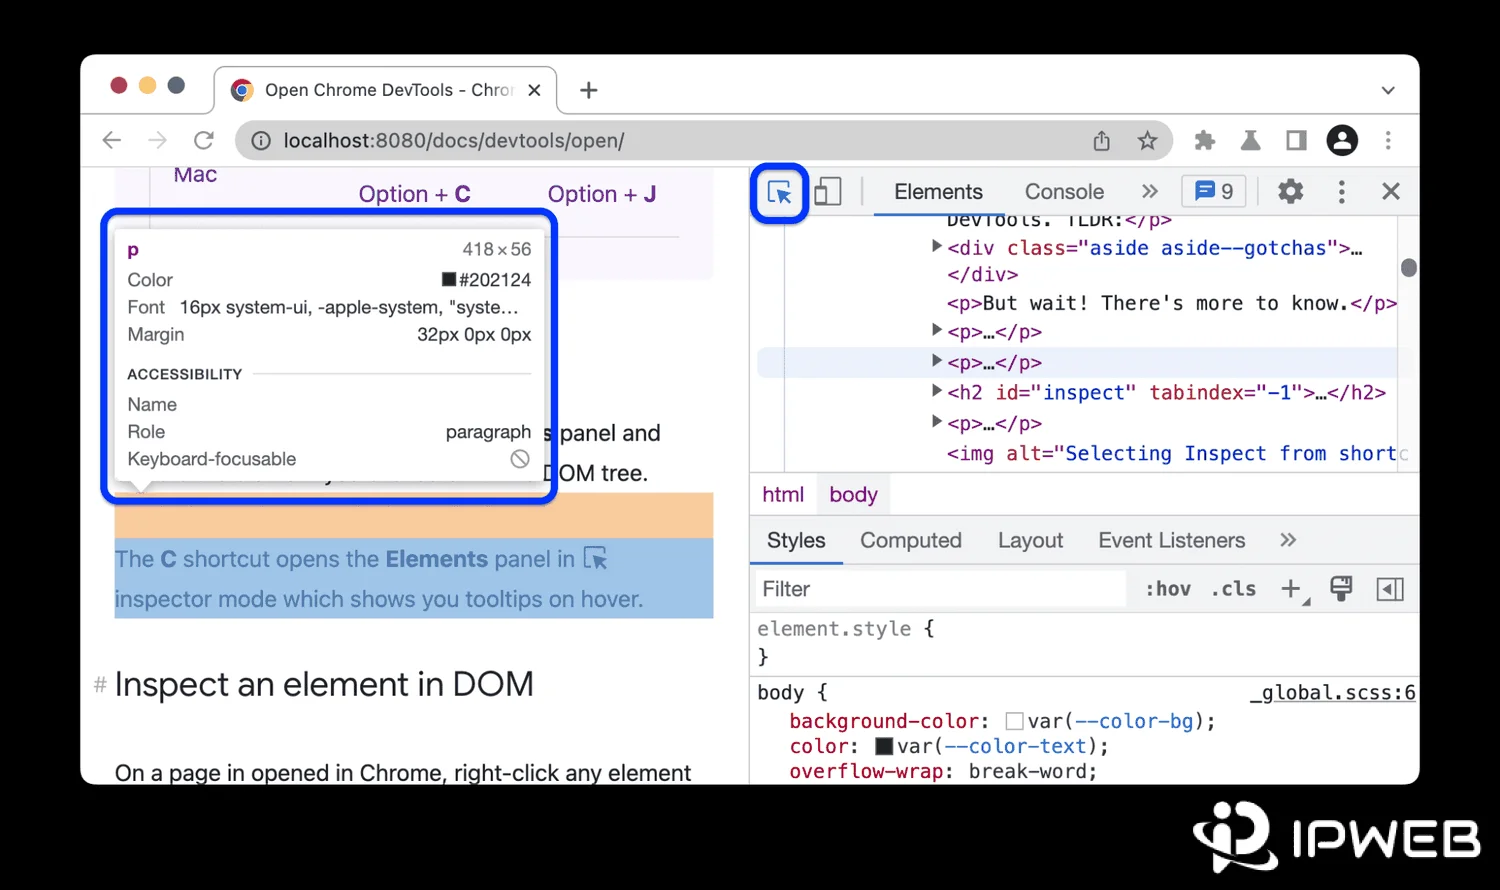
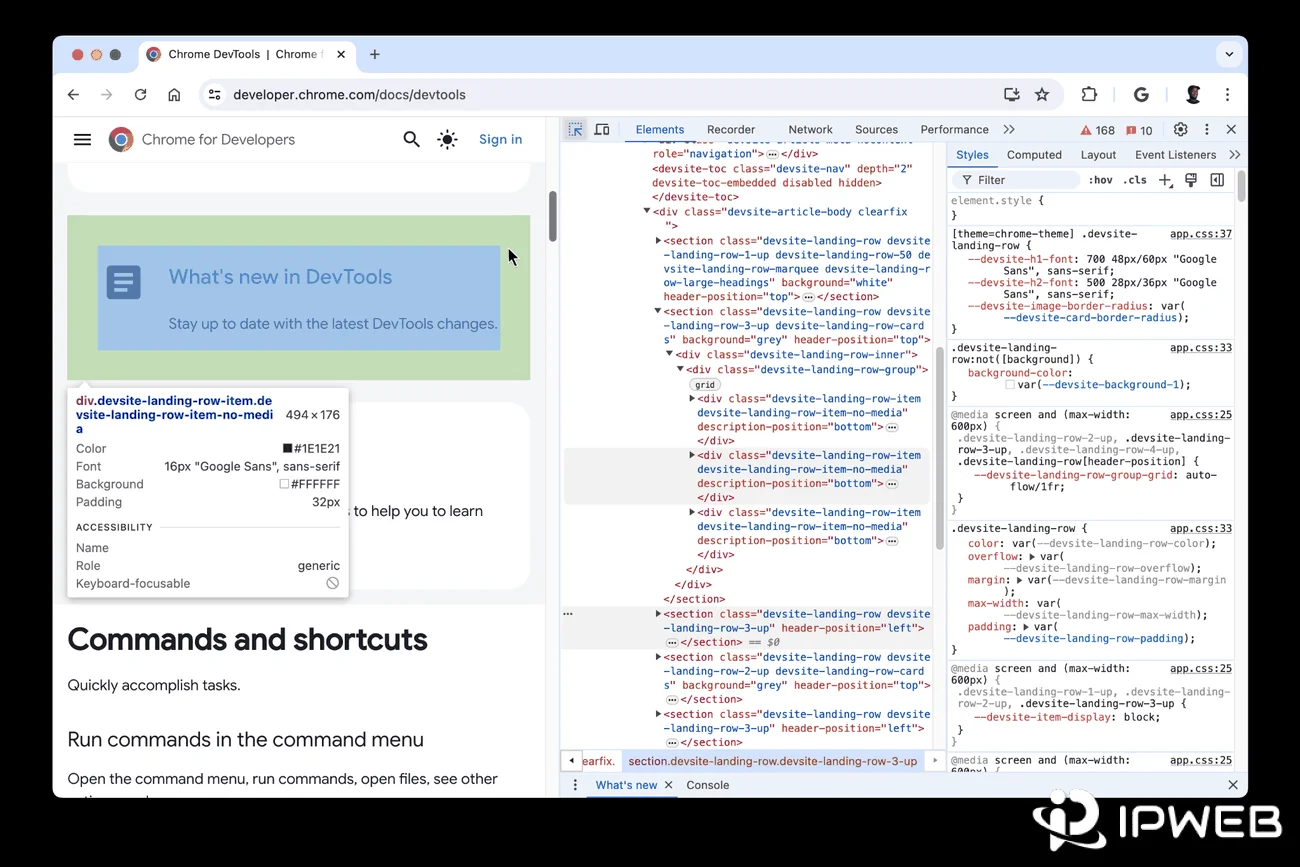
In Chrome, the fastest method is to Control-click the exact element you want to examine and choose Inspect. Chrome opens DevTools with the corresponding DOM node selected in the Elements panel.
You can also use Command + Option + C to open the Elements panel in inspect mode. Use Command + Option + I when you want to open DevTools at the last panel you used. Google documents both shortcuts in the Chrome DevTools guide.
Before reading a selector or attribute, make sure the page is in the state you actually need. If the value appears only after choosing a filter, opening a tab, or loading more results, inspect it after that action.
Inspect Element in Safari on Mac
Safari hides its developer features until they are enabled. Open Safari > Settings > Advanced, then select Show features for web developers. Apple documents this setting in its Safari developer tools guide.
After developer features are enabled, Control-click a page element and choose Inspect Element. You can also choose Develop > Show Web Inspector or press Option + Command + I.
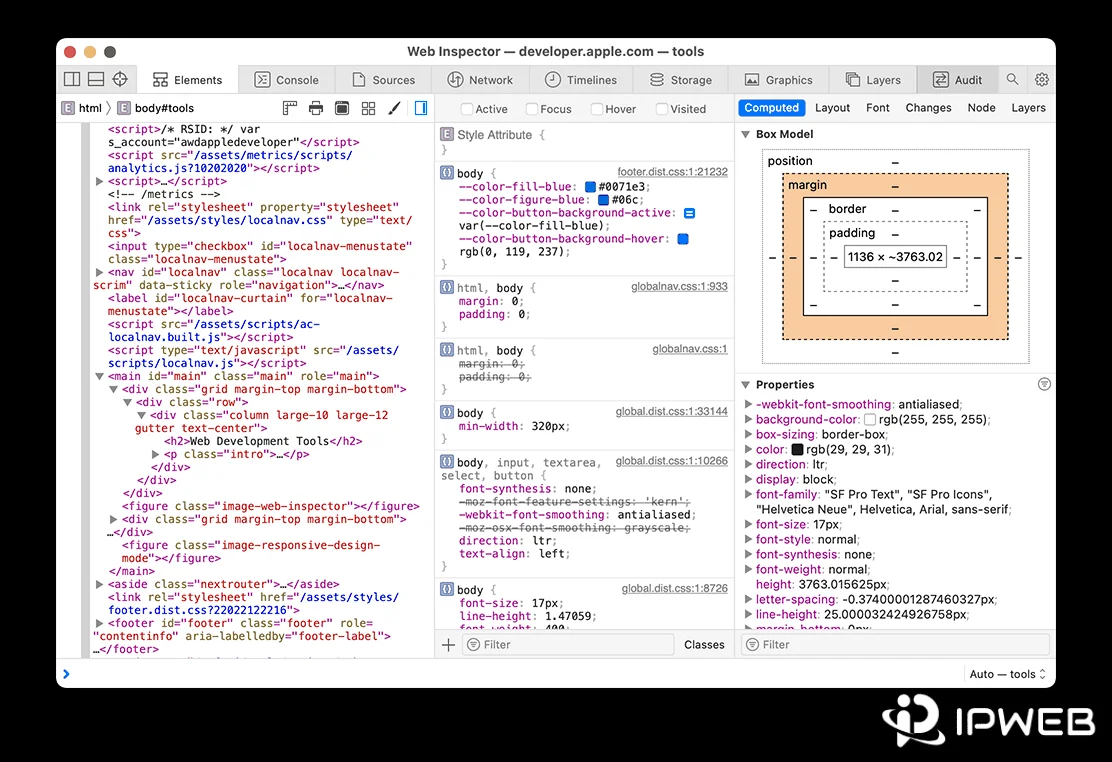
Safari Web Inspector provides DOM, resource, network, storage, console, and other debugging views. The names and layout differ from Chrome, but the same basic diagnostic question applies: determine where the value appears and when it becomes available.
Inspect Element in Firefox on Mac
In Firefox, Control-click a page element and choose Inspect to jump directly to the Inspector. Command + Option + I opens the developer toolbox, and Firefox also provides a page-element picker for selecting nodes visually.
Firefox calls its DOM view the Inspector rather than the Elements panel, but it serves the same core purpose: inspect the current DOM, review CSS, and locate stable page fields before building an automated workflow.
| Browser | Context-menu method | Mac shortcut | Primary DOM view |
|---|---|---|---|
| Chrome | Control-click > Inspect | Command + Option + C for Elements; Command + Option + I for DevTools | Elements |
| Safari | Control-click > Inspect Element after enabling developer features | Option + Command + I | Elements in Web Inspector |
| Firefox | Control-click > Inspect | Command + Option + I | Inspector |
The shortcut is useful, but the page state matters just as much. Inspect the same version of the page that your later workflow is expected to process.
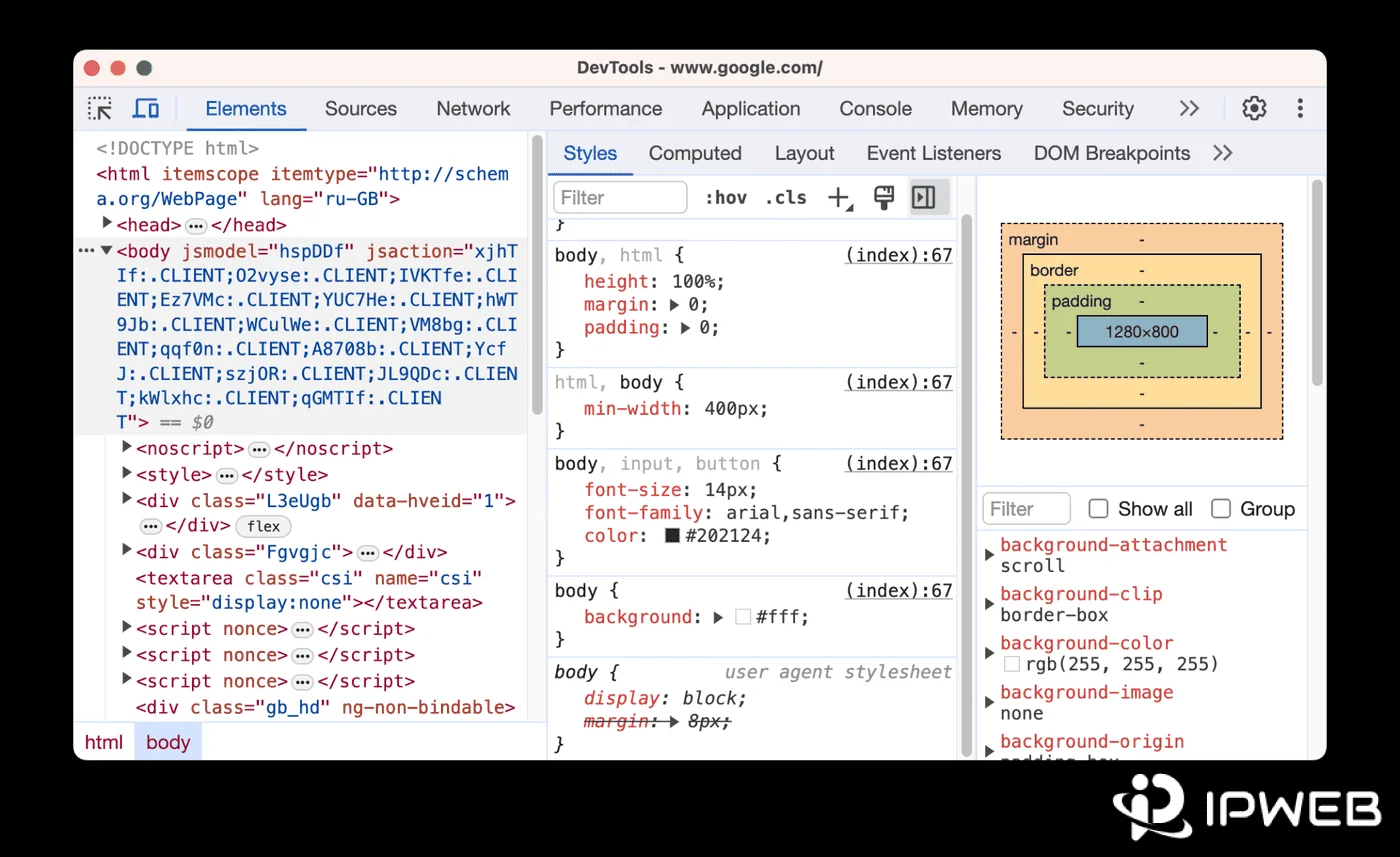
Use Elements to Check Page Structure
The DOM view shows the structure the browser is using at that moment. A visible value may appear as text inside an element, an attribute, a nested component, or content inserted after JavaScript runs.
Look for stable containers, semantic labels, attributes, and repeated field patterns before relying on visual CSS classes. Classes generated by a frontend framework or build process can change without the underlying field meaning changing.
If you are new to the broader extraction workflow, what web scraping is explains how page discovery, field extraction, validation, and output fit together.
Use Network to Check Dynamic Data
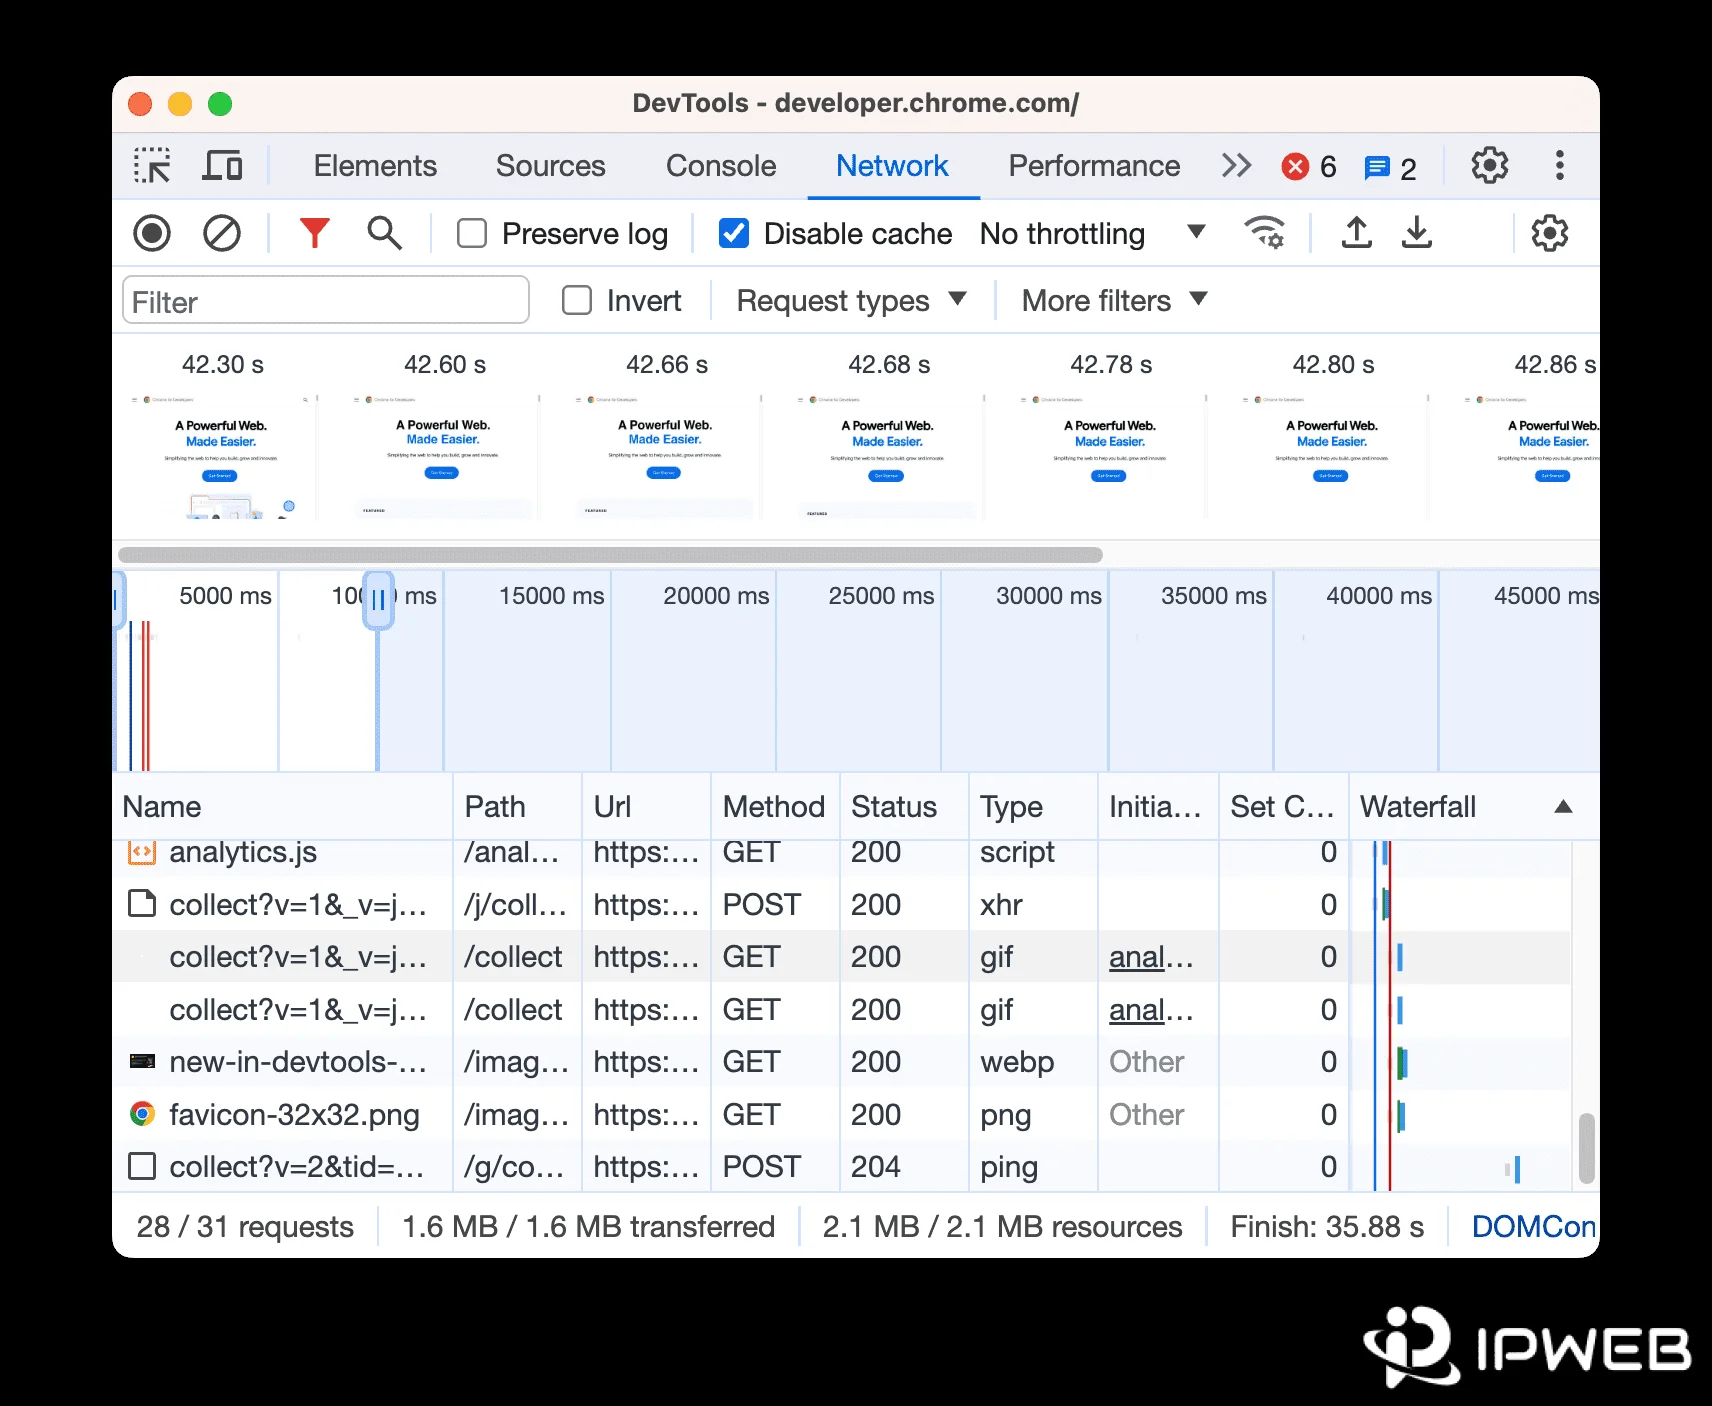
If the screen shows a value but you cannot find it in the expected HTML, open the Network panel and reload the page. Filter for document, fetch/XHR, or JSON-like responses, then inspect the requests that occur when the page loads or when you trigger the relevant interaction.
Useful checks include the request URL, status code, content type, timing, response structure, and whether the record appears before or after a click, scroll, filter, or pagination event.
If you are testing repeated reloads, temporarily disable the browser cache in DevTools so cached resources do not hide new network activity. In Chrome, the Disable cache option applies while DevTools is open.
When JavaScript loading is the main problem, continue with the web scraping dynamic content guide. It covers the decision between reading a later network response and using a browser-rendered workflow.
When Inspect Element Is Not Enough
Inspect Element is a manual diagnostic tool. It does not crawl a site, manage pagination, retry failed requests, normalize fields, store records, or repeat interactions across many pages.
If the required page state depends on JavaScript execution or interaction, browser automation may be the next step. The What Is WebDriver guide explains browser-control fundamentals, while what headless browsing is covers browser execution without a normal visible window.
Inspection should end with a clear workflow decision: the field is in static HTML, it arrives through a network request, it appears only in a rendered DOM, or the source is not suitable for the intended collection task.
Frequently Asked Questions
Control-click the element and choose Inspect or Inspect Element. In Chrome, Command + Option + C opens the Elements panel in inspect mode. In Safari, enable developer features first, then use the context menu or Option + Command + I.
Chrome uses Command + Option + C for the Elements inspector and Command + Option + I for DevTools. Safari uses Option + Command + I for Web Inspector after developer features are enabled. Firefox uses Command + Option + I to open its developer toolbox.
Safari developer features may be disabled. Open Safari > Settings > Advanced and enable Show features for web developers, then try the context menu again.
The Network panel can show requests made by the page, including many fetch and XHR requests. Whether a response is appropriate to use still depends on the source, access permissions, and the intended workflow.
No. Edits made in browser DevTools only change the page in your local browser session. They do not modify the website's server-side source and normally disappear when the page is reloaded.
Check whether the required fields exist in the initial HTML, the rendered DOM, or a later network response. Also confirm that the page state, source permissions, and field context match the intended workflow.
No. Inspect Element is manual browser inspection. WebDriver is an automation interface that controls supported browsers programmatically for testing and browser-based workflows.
Final Thoughts
Inspect Element on Mac is most useful when it answers a specific question: where a page field exists, when it becomes available, and which browser panel proves it. Start with the browser's built-in inspection tools, then move to static parsing, network-response handling, or browser automation only when the page structure requires it.